Core Web Vitals Report
RELEASED
2021
ROLE
Redesign, discovery and ideation, user research, usability testing, interaction design and prototyping.
TOOLS
Figma
Ryte is a web-based tool and all-in-one platform for website quality assurance and SEO. We give SEOs a holistic perspective of the overall health of their website, from addressing technical issues such as broken pages or redirects, giving legal compliance assistance under GDPR and for this particular case, providing performance analyses for their entire domain.
Problem Statement
How might we provide SEO with a holistic perspective in their technical analyses?
Site performance can greatly affect the user experience and potential conversion of a domain. With many different metrics and guidelines to shoot for, Technical SEOs are struggling to understand how the pages of their domains’ performance truly stand against Google’s set standards. Additionally, SEOs still need a way to prioritize fixing important and poorly performing pages from the rest of the pages within their domain.
Our existing Page Speed Report aimed to show users which pages of their domain are seen by Google Lighthouse as "Very Slow", "Slow" and "Fine". However, with the new announcement of Google's Core Web Vitals, a truer standard to measuring site performance, these metrics presented in our report are now outdated. In order to bring a holistic perspective, this report needed to be updated to align with the Web Vitals. However, new metrics would mean that the way the report shows its data would also need to change.
Main Considerations:
- Up to date metrics - There are too many different tools and metrics for Page Speed performance, which makes it difficult for SEO to know where to focus their optimization efforts. How do we display this new information in the report for our users in a way that is clear and trustworthy?
- Holistic Analyses - Identifying slow pages on your website can be cumbersome with Lighthouse because it can only analyze one page at a time versus an entire domain. How do we make sure that the user can clearly understand an overall impression of their domain's performance?
- Actionable Takeaways - How can we show insights that lead to actions to improve page performance in an efficient and clear way?
Process
1. Understanding the Problem
Google's Core Web Vitals provide a north star for SEOs to know where they stand in domain performance. It is clear that our report needed to be brought up to speed to show Google's Core Web Vitals metrics like LCP (Largest Contentful Paint), FCP (First Input Delay is actually the main web vital, but due to technical constraints we will provide the First Contentful Paint metric), and CLS (Cumulative Layout Shift) - metrics indicative of a well-performing site - so our users are able to aim for better optimization.
However, most people still need guidance with what to do next. I needed to understand what implications and considerations should be made once we adapt these new metrics into our report. How would we lay out this new data? I also needed to know how problem areas are prioritized by our users, as well as which factors affect speed and performance in pages and how fixes are then made. Once they identify these problematic pages, what do SEOs do next?
With our Product Owner, we discussed the questions we wanted to validate, and were mostly explored through usability testing.
2. Wireframing
With this report, we want to make sure that we provide contextual information using components we have already built within the tool, such as the assets embedded into each page, directory and host overviews that shows clusters of pages together, advanced filters to narrow the results to particular attributes of a page, and our "Super Inspector", which allows closer detail into the status of each page. But how does it all come together? Also, what would our expert-level users find valuable? In this step, I built wireframes that included the team's knowledge and assumptions as well as our solutions to these problems.
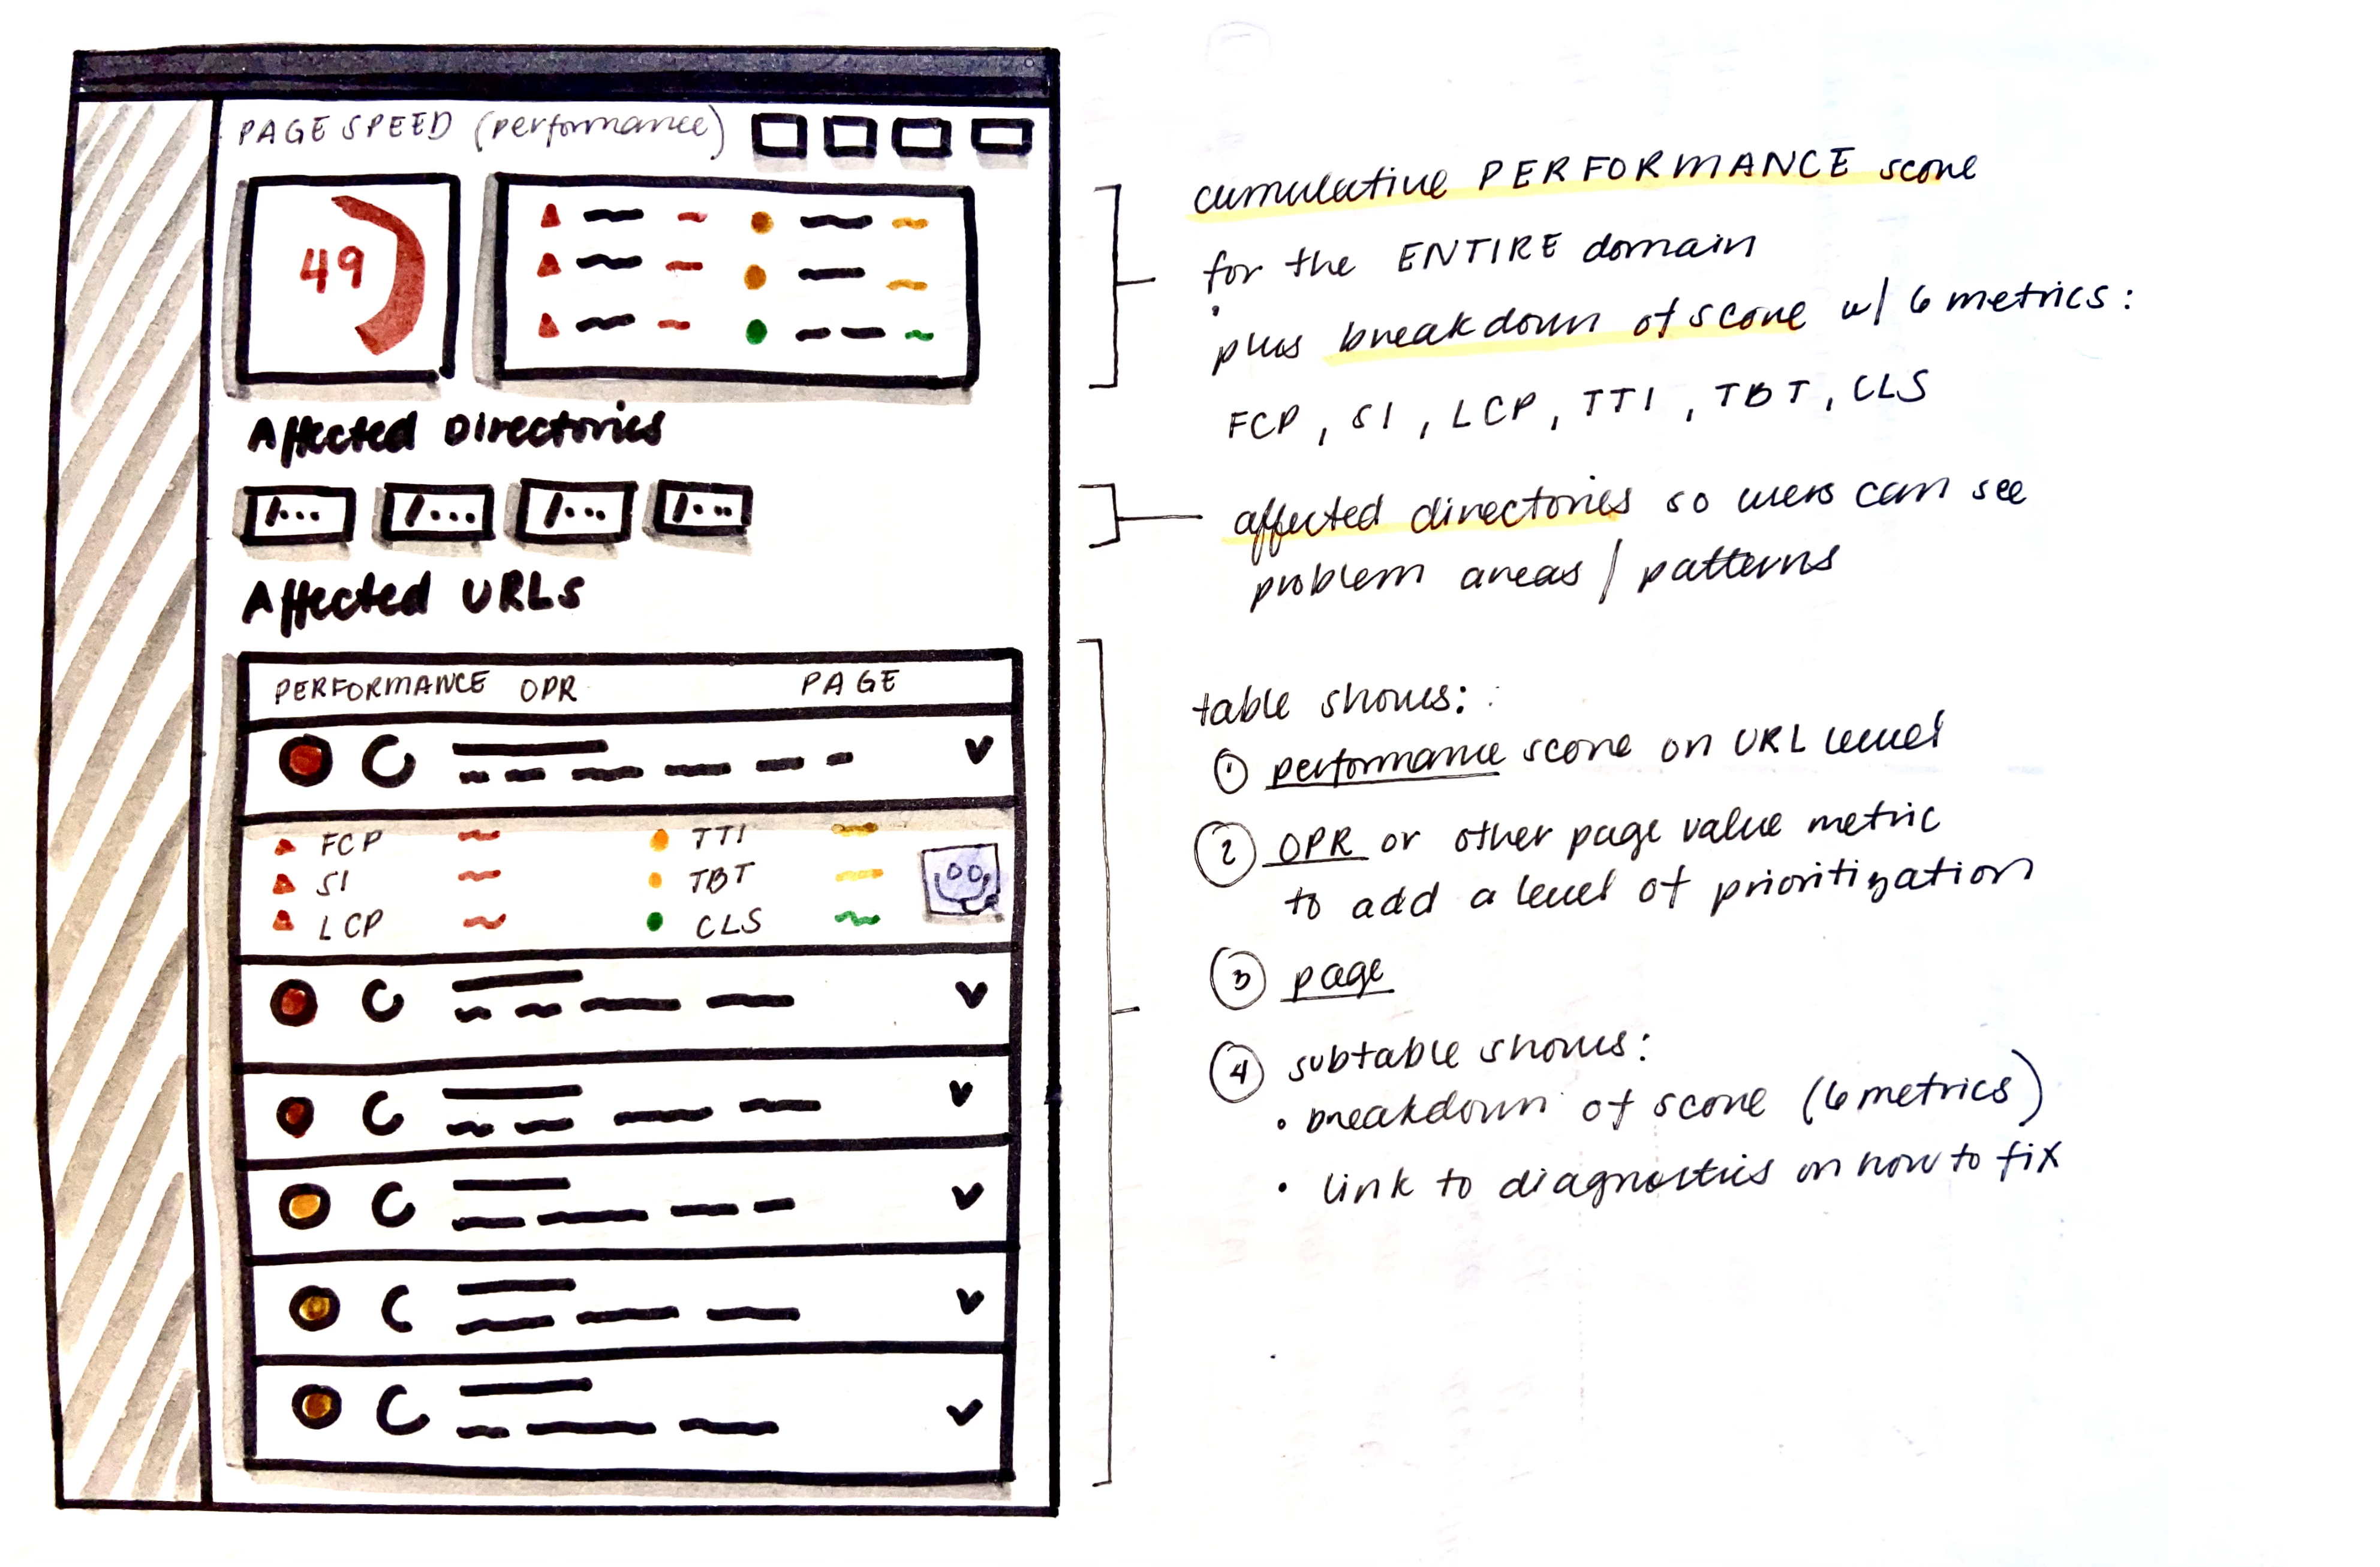
Determining how the new Web Vitals would be introduced into the outdated report.
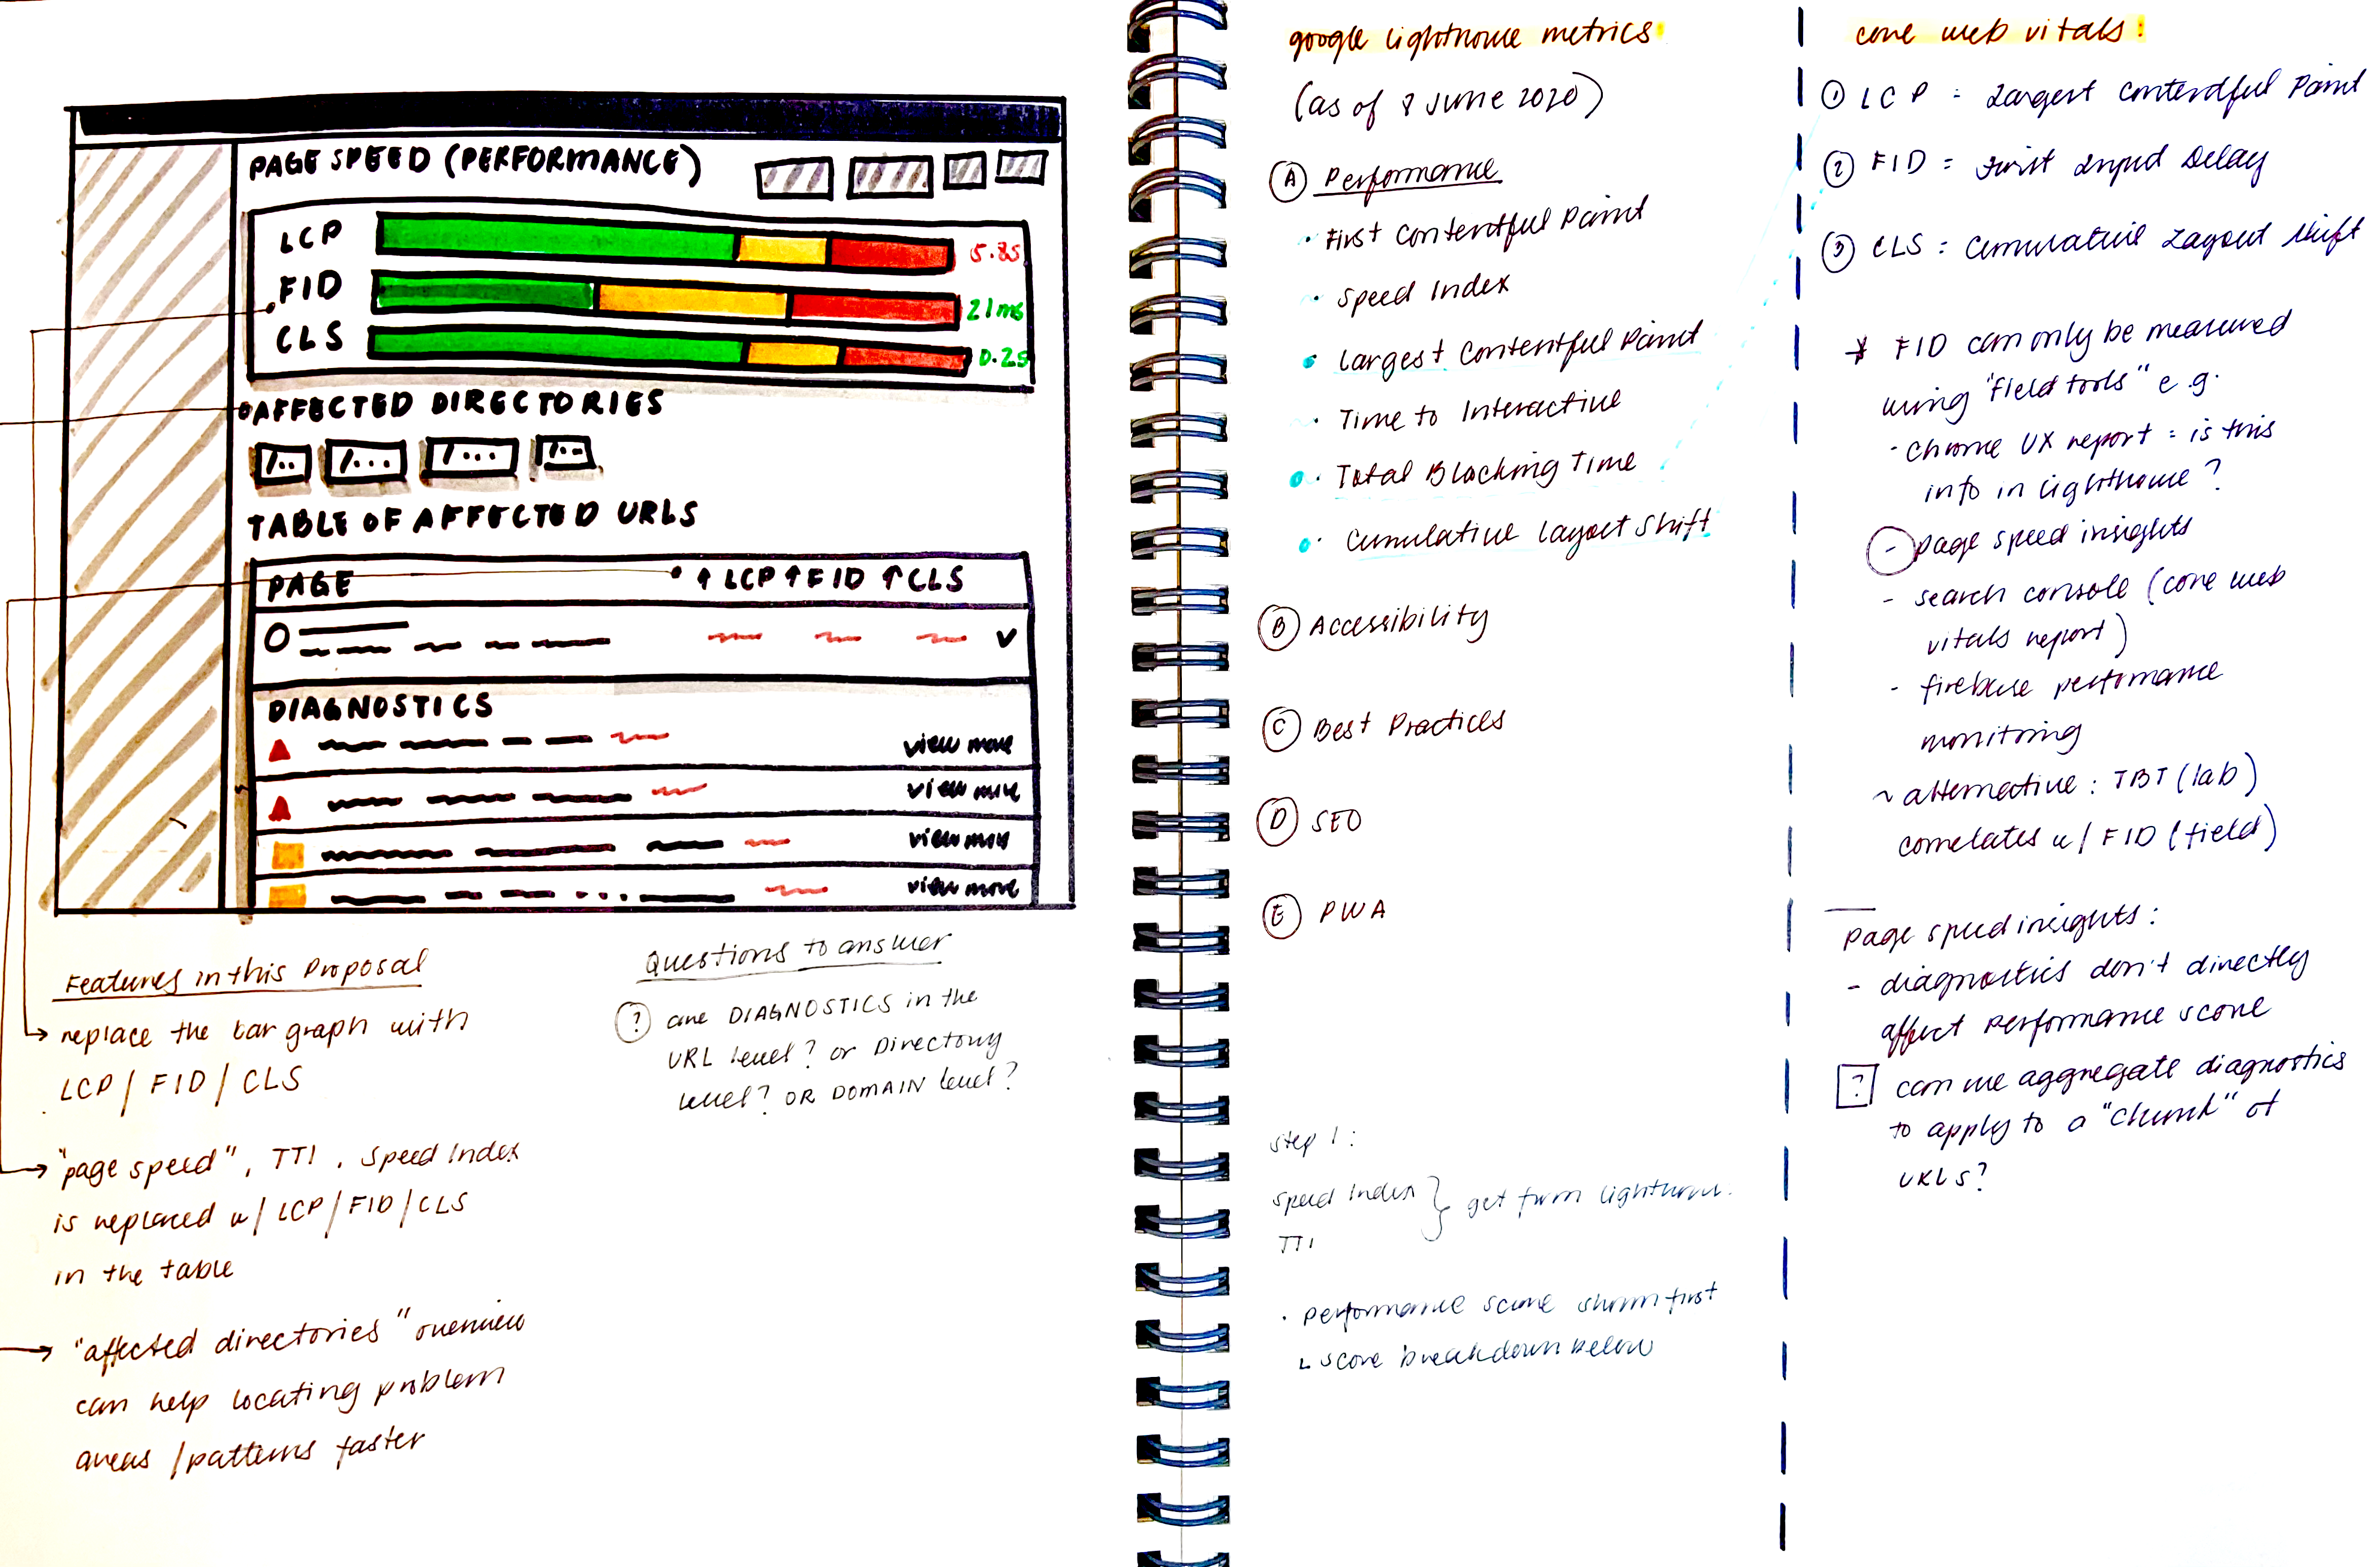
Understanding the Core Web Vitals and how it fits within Google Lighthouse.
3. Prototyping and User Testing
User testing is an important method in discovering answers to such questions. By building a prototype with Figma from the wireframes and setting up use case scenarios to present to our users, I was able to see where the design would work and not work. After multiple testing sessions with 3 Tech SEOs, 1 Content SEO Manager and 1 developer, we built an MVP that suited their identified needs. I discovered that some of these assumptions were not exactly ideal solutions for certain personas, but worked for others.
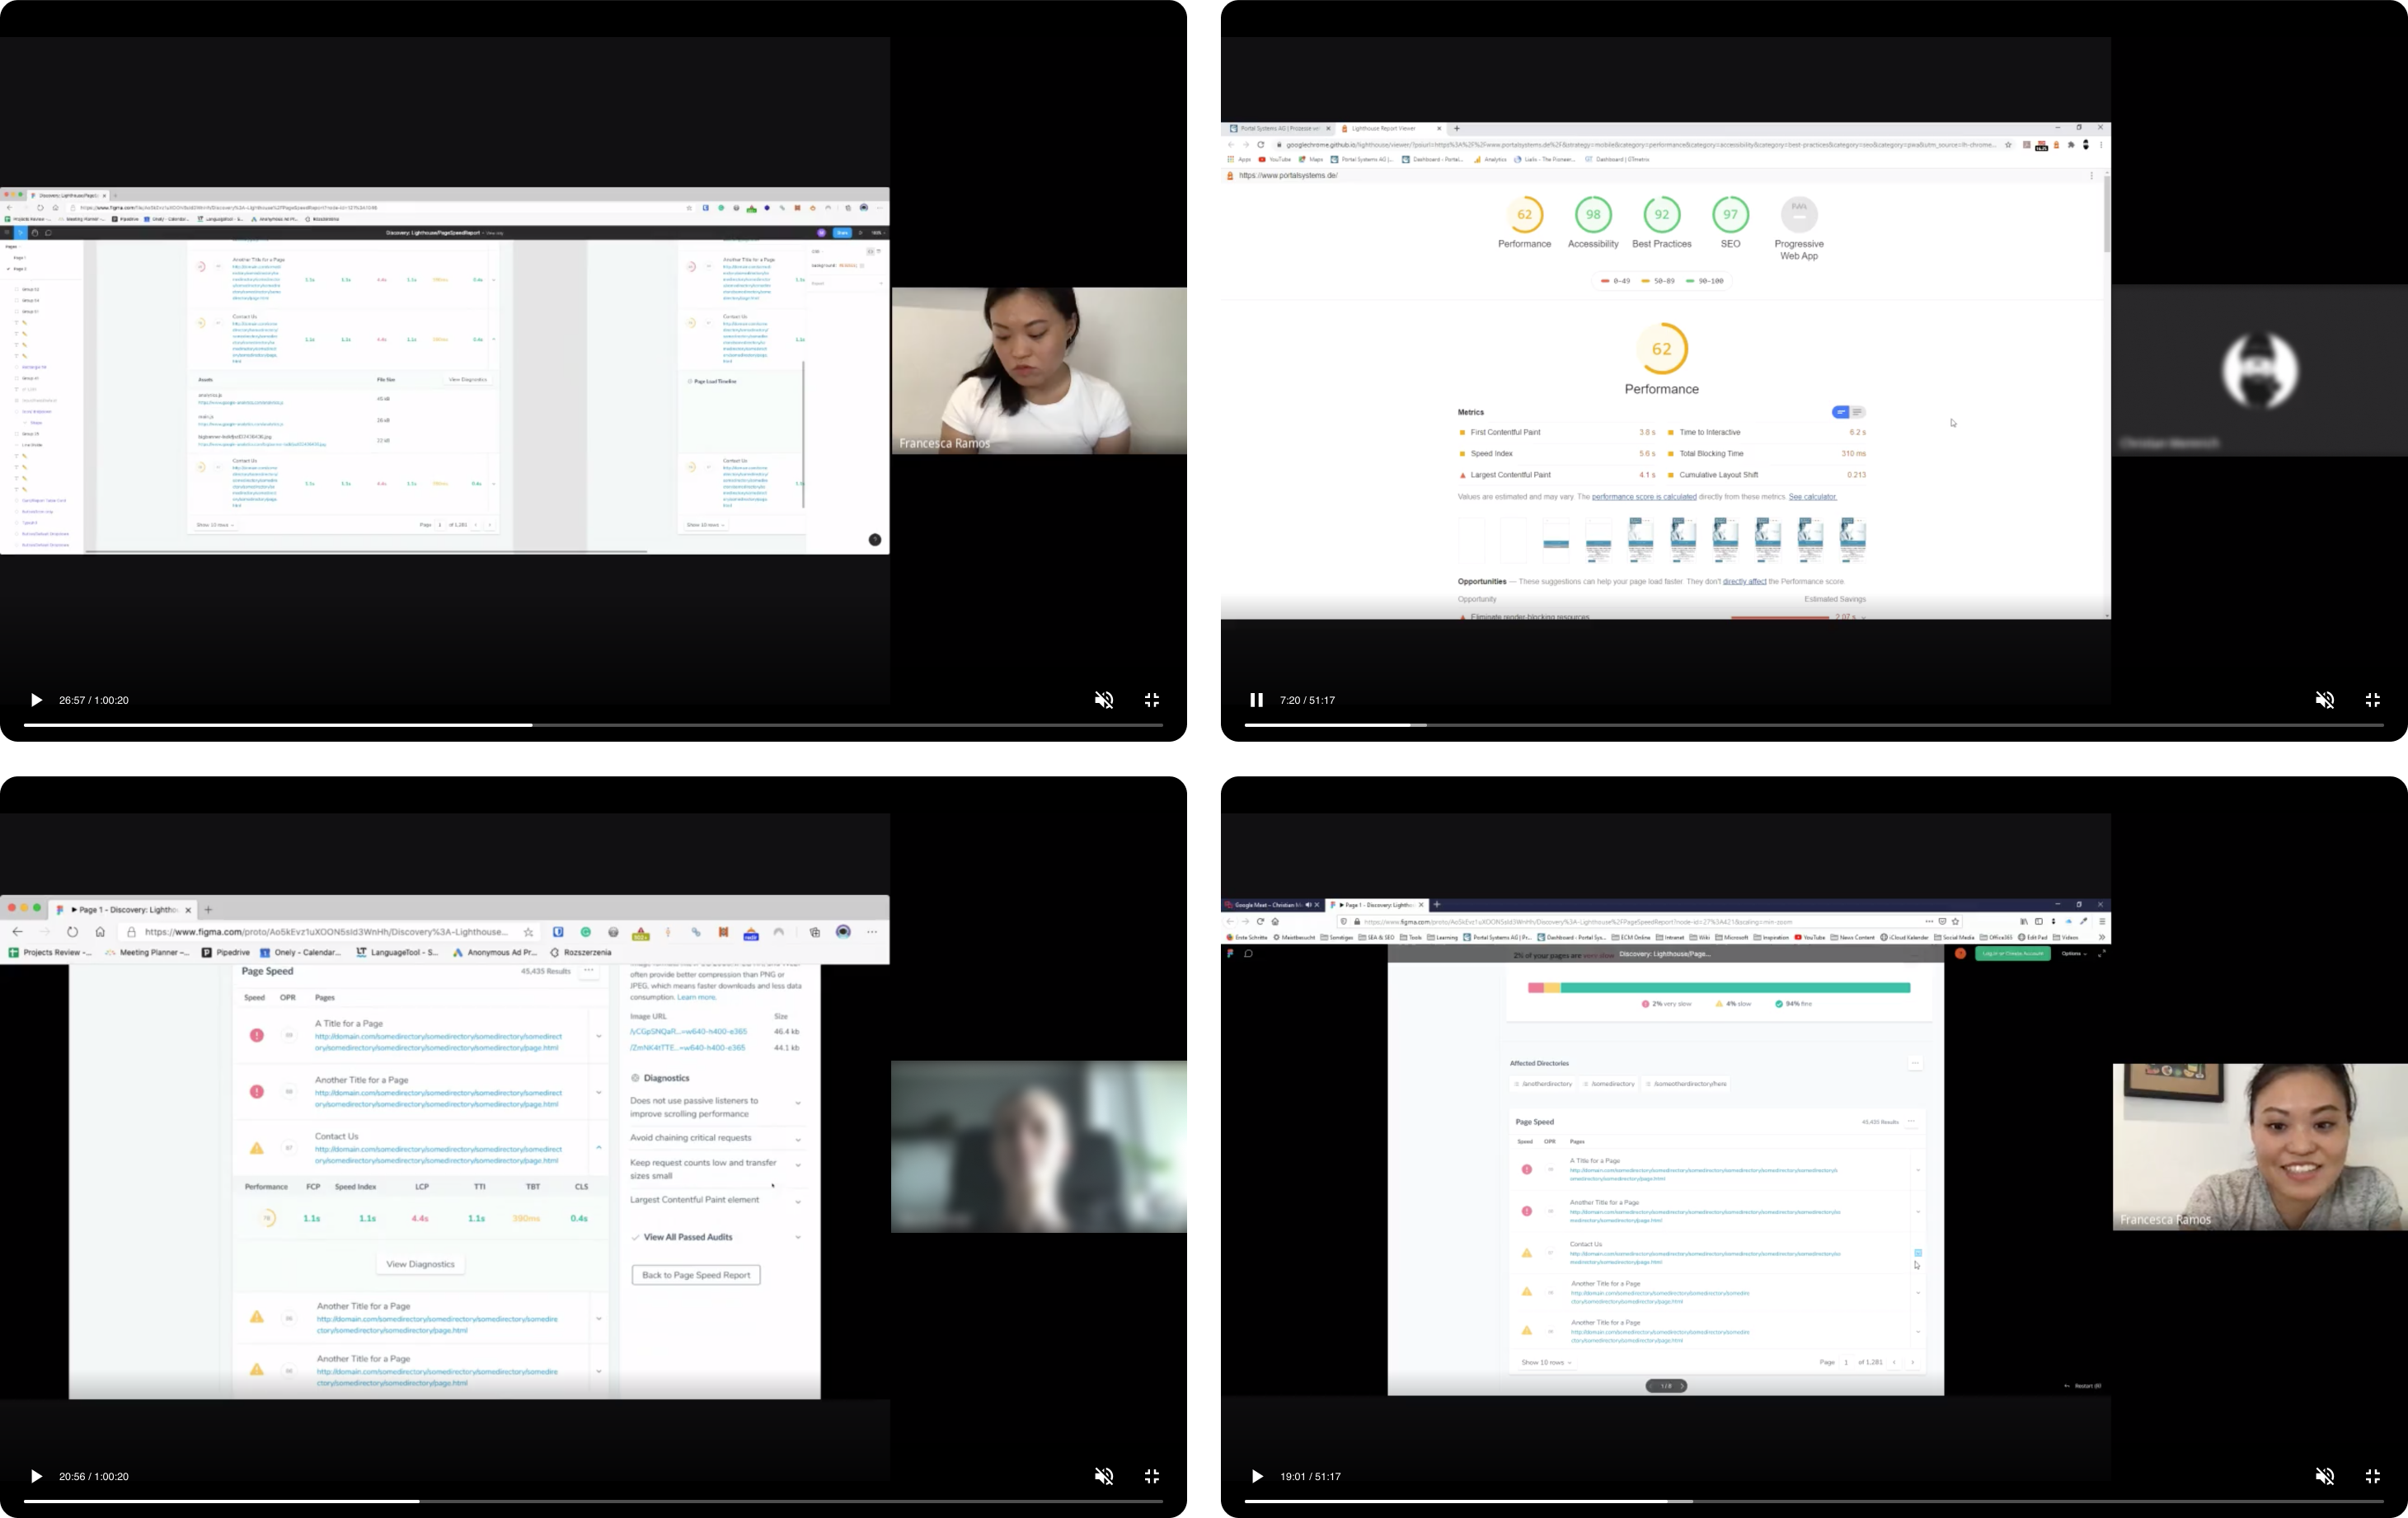
Remote user-testing sessions with users in Hamburg, Germany and Wroclaw, Poland.
4. Explorations
After synthesizing my user interviews, I considered a lot of what my Tech SEO persona mentioned, and came up with several design drafts for a use case in which she can identify where the metric timings are and what is happening to the page itself. This helps her see immediately what the problem area is in order to make fixes. Upon discussing during refinement with the developers, I realize that they were too complex in terms of implementation, and therefore settled with a simpler solution (shown in the later stages). The simpler solution is also preferred as it seemed more accessible to the rookie SEO persona, and so we went forward with that.
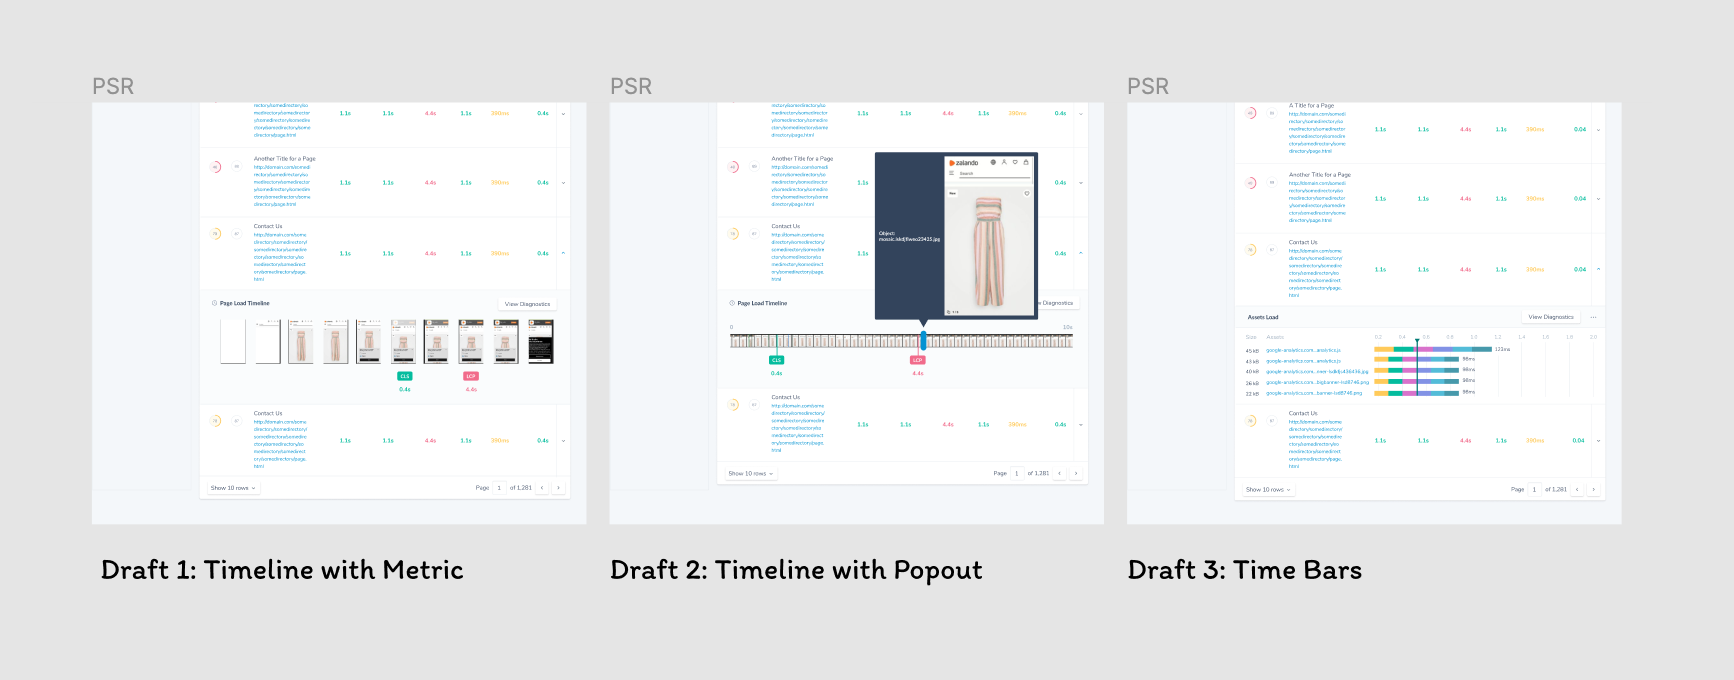
Solution
With the released MVP, our users can now gauge their own KPI’s against a futureproof, Google-driven metric using our tool with a one-stop-shop for prioritizing performance fixes in their entire domain. This unfortunately did not include the various drafted features (involving draggable timelines, for example) that could accomodate more expert-level SEO's, due to its complexity. The tradeoff then was to have the new Core Web Vitals metrics present along with the "Assets" drawer which was easier to implement and develop. This MVP allowed users to evaluate third party assets that could weigh down and slow the performance of the page.
Because the metrics presented now align with Google's Core Web Vitals standard, Tech SEOs know they can rely on the data they see in Ryte. Combining it with overviews that show potential issues within areas of their domain, users can now see problem patterns so they don't need to spend time looking in different places.
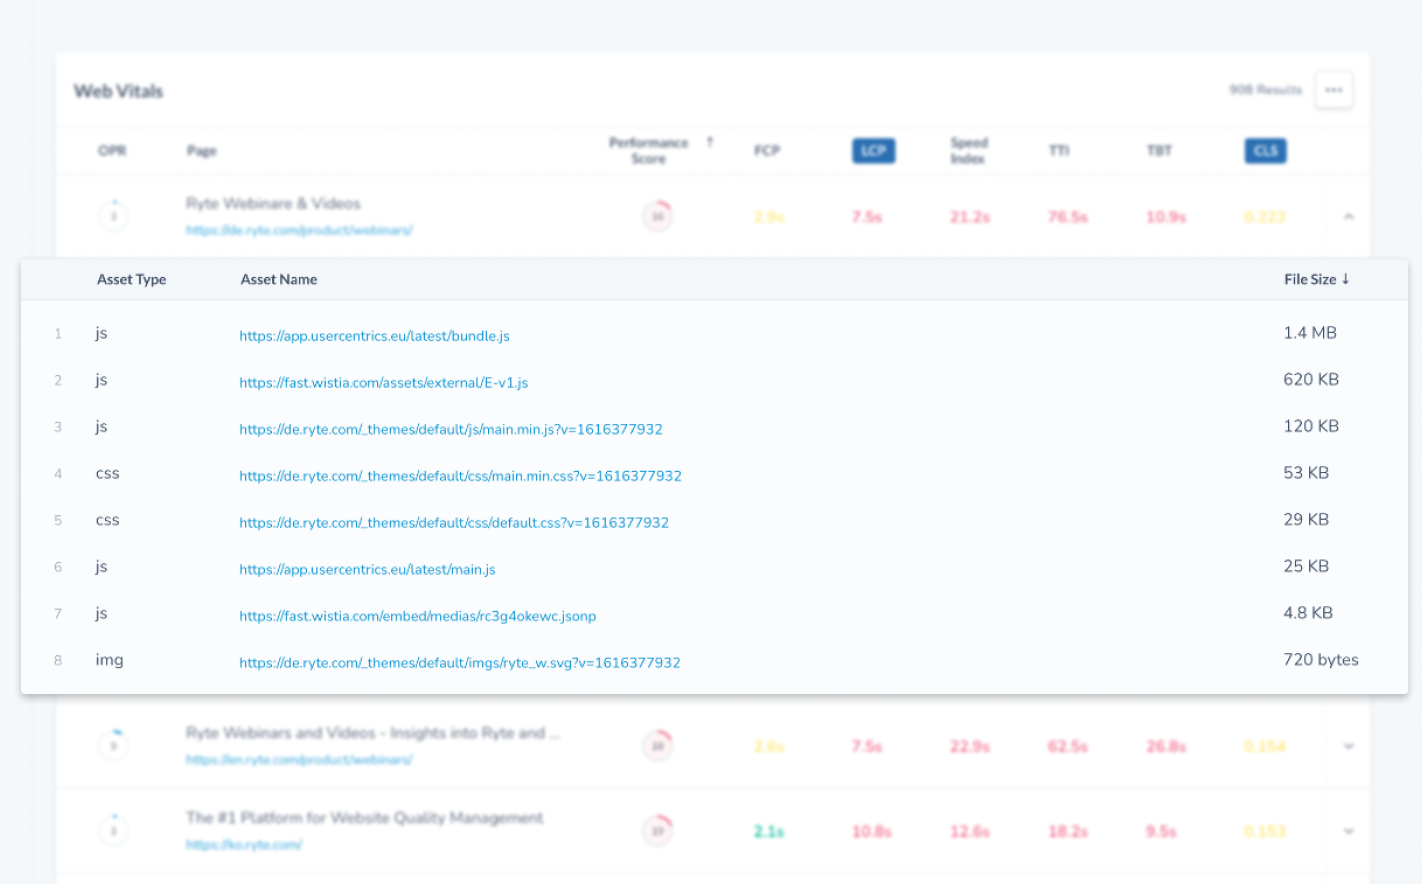
Access the assets. From my user interviews, I found that slow page load can be due to big assets in each page, including large images, template-based javascript, or css. With this solution, users can get to the problem faster through the Assets drawer.
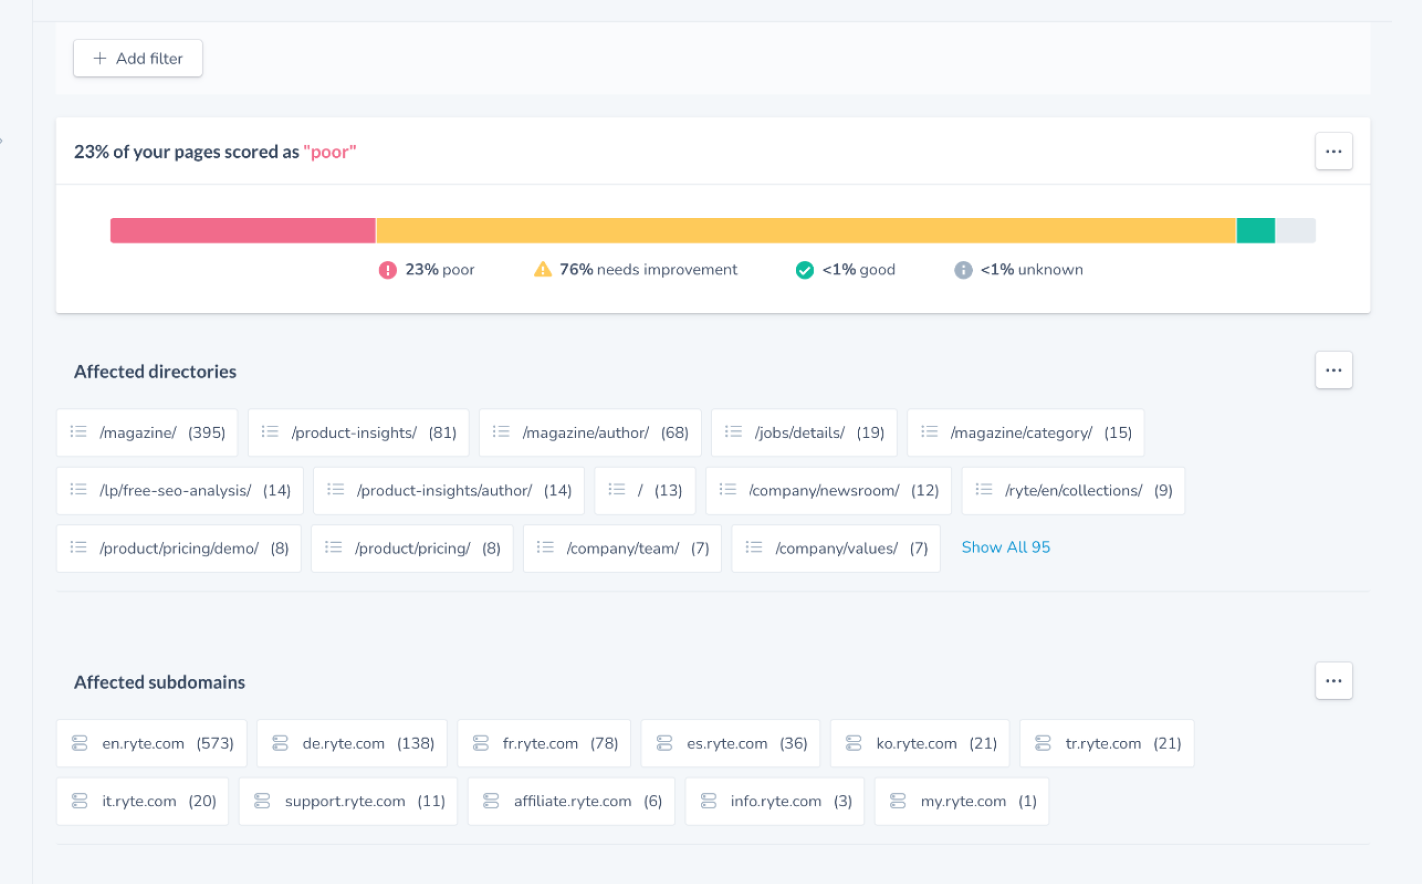
Get a wider perspective. Users are shown the gravity of the problem and bringing a wider perspective of performance within your domain, not only for a single URL. Shows contextual information for slowness, such as all assets in a particular page, directory/host overviews, advanced filters and the super inspector.
Learnings and Outcomes
- Being concrete with the persona.
I've learned that depending on a user's level of expertise, what they need to see will also differ. Initially, there was a lack of focus on which type of SEO we wanted to cater to: the pro or the rookie. For the pro, we want to accomodate the expert level Technical SEO, but Chrome DevTool's Performance tool, specifically the timeline feature, might be more reliable for certain use cases. Revisiting the timeline feature would be needed here. For the rookie, we wanted to provide more clarity and to display actionable "quick-wins", as well as a personalized, AI-driven recommendation that uniquely assesses the site for the user. However, the latter was out of scope. - Challenges in recruiting user interviews.
One of the other challenges is recruiting the ideal user. Process-wise, I would have liked to interview more people that fit the user persona we were aiming for. Instead, I spoke to different users with different levels of expertise and ended up with a solution that fits in between. For next time, I would like to recruit more people sooner with the help of Customer Support. - Immersion into Industry Knowledge.
SEO can be a complex topic with a niche industry. A lot of terminology and processes needed to be studied in order to truly understand who the users are and how they needed to achieve their goals. I felt that I had little understanding of the user flow and user goals before developing the feature, which I mitigated by using my user interview sessions as education sessions as well. This established a working relationship with our users, where we invite them to voice their insights and therefore become invested in what we're building in order to improve their experience.
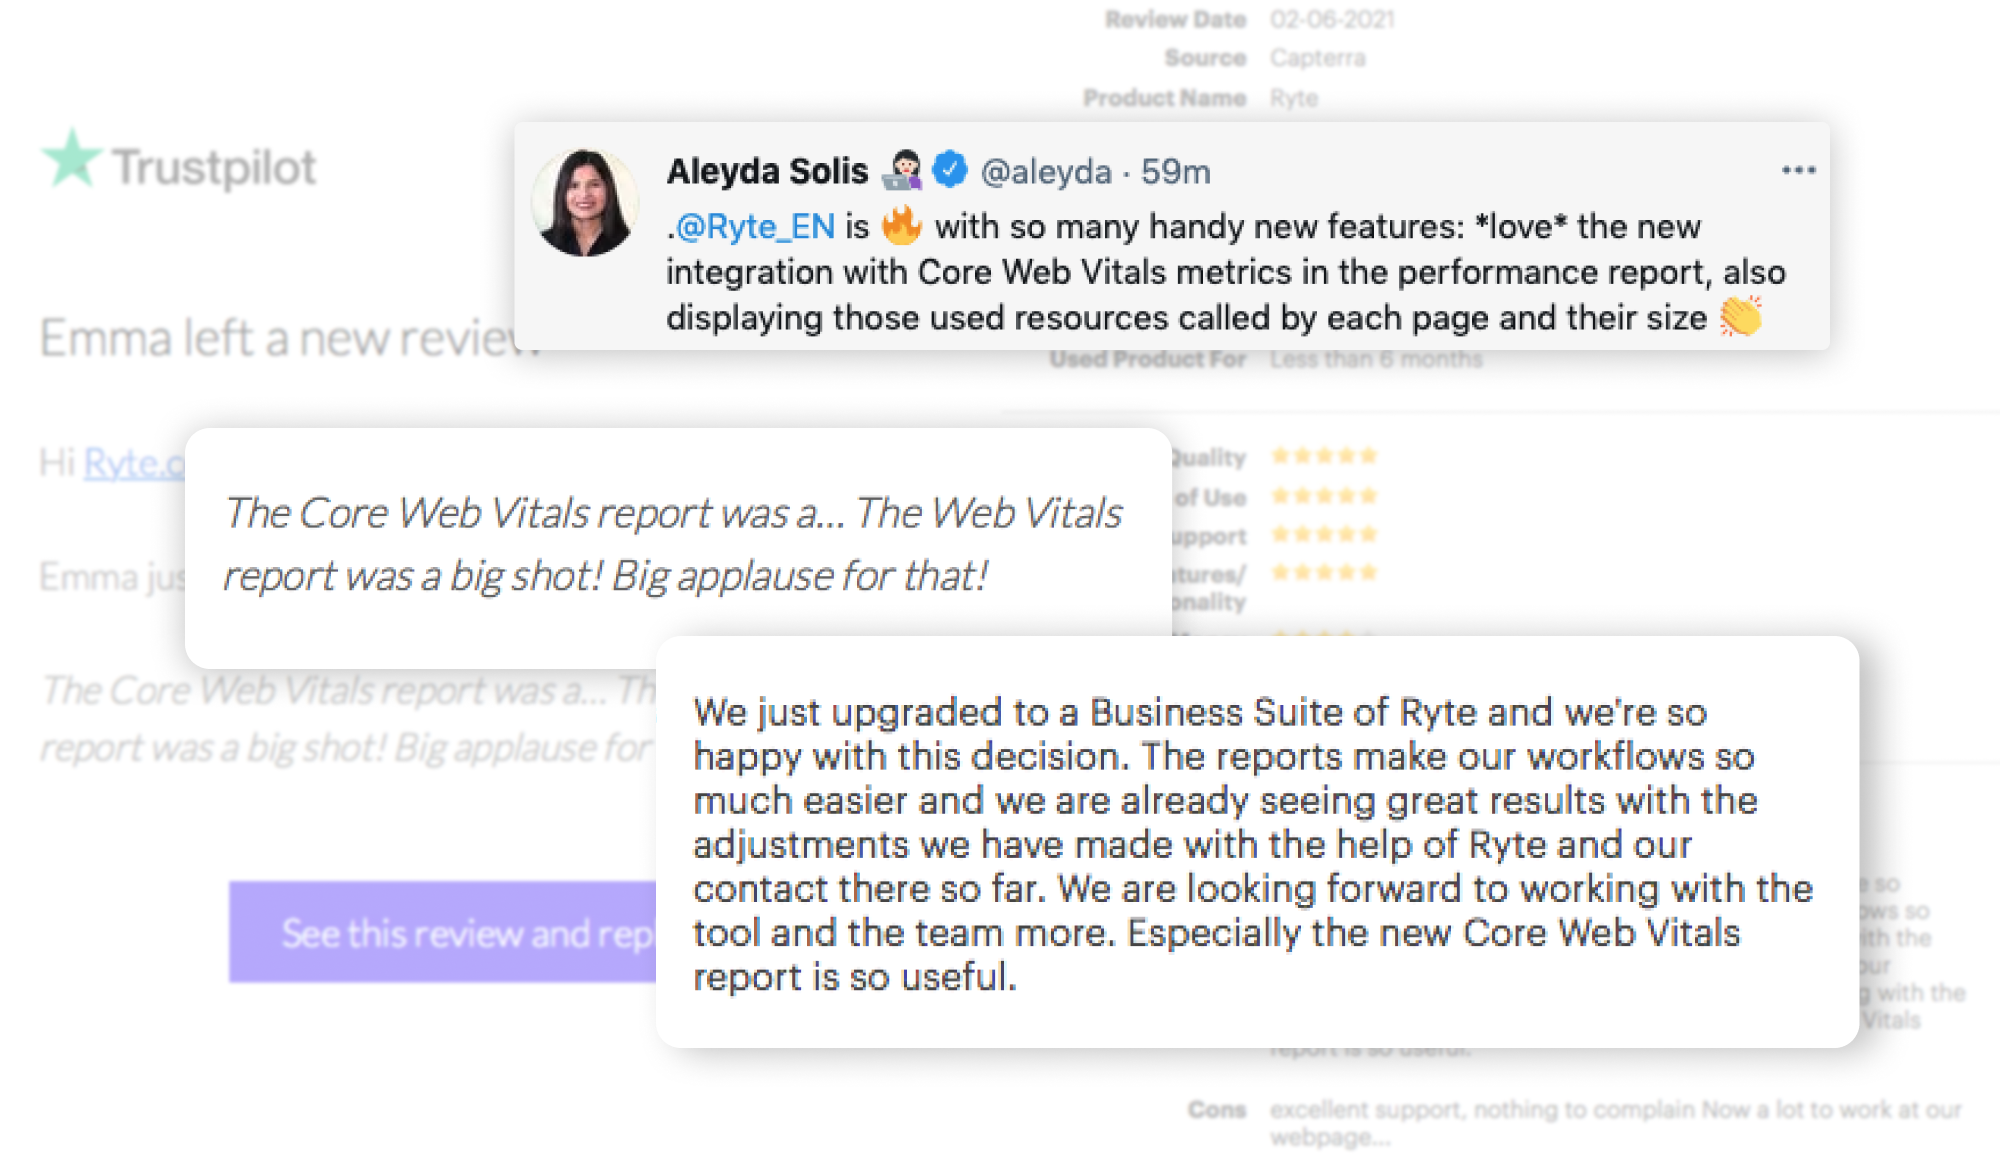
Since it's release, the MVP was well-received and is a core selling feature for new customer contracts and existing customers looking to upgrade their packages. It's on the precipice for further improvements in the future.
